How to Deposit Liquidity
This is a guide to all the features you will see on the A51 dApp while adding liquidity.
Once you land on the A51 dApp, connect your wallet.
Click Strategies on the top navigation bar.
The Strategies Page
On the All Strategies page, there is a list of all the strategies created on different pools on a particular DEX and chain. To select a pool on your desired DEX and chain, go to the drop-down menu on top-left corner of the page.
In the search bar, you can also directly search your desired strategy.
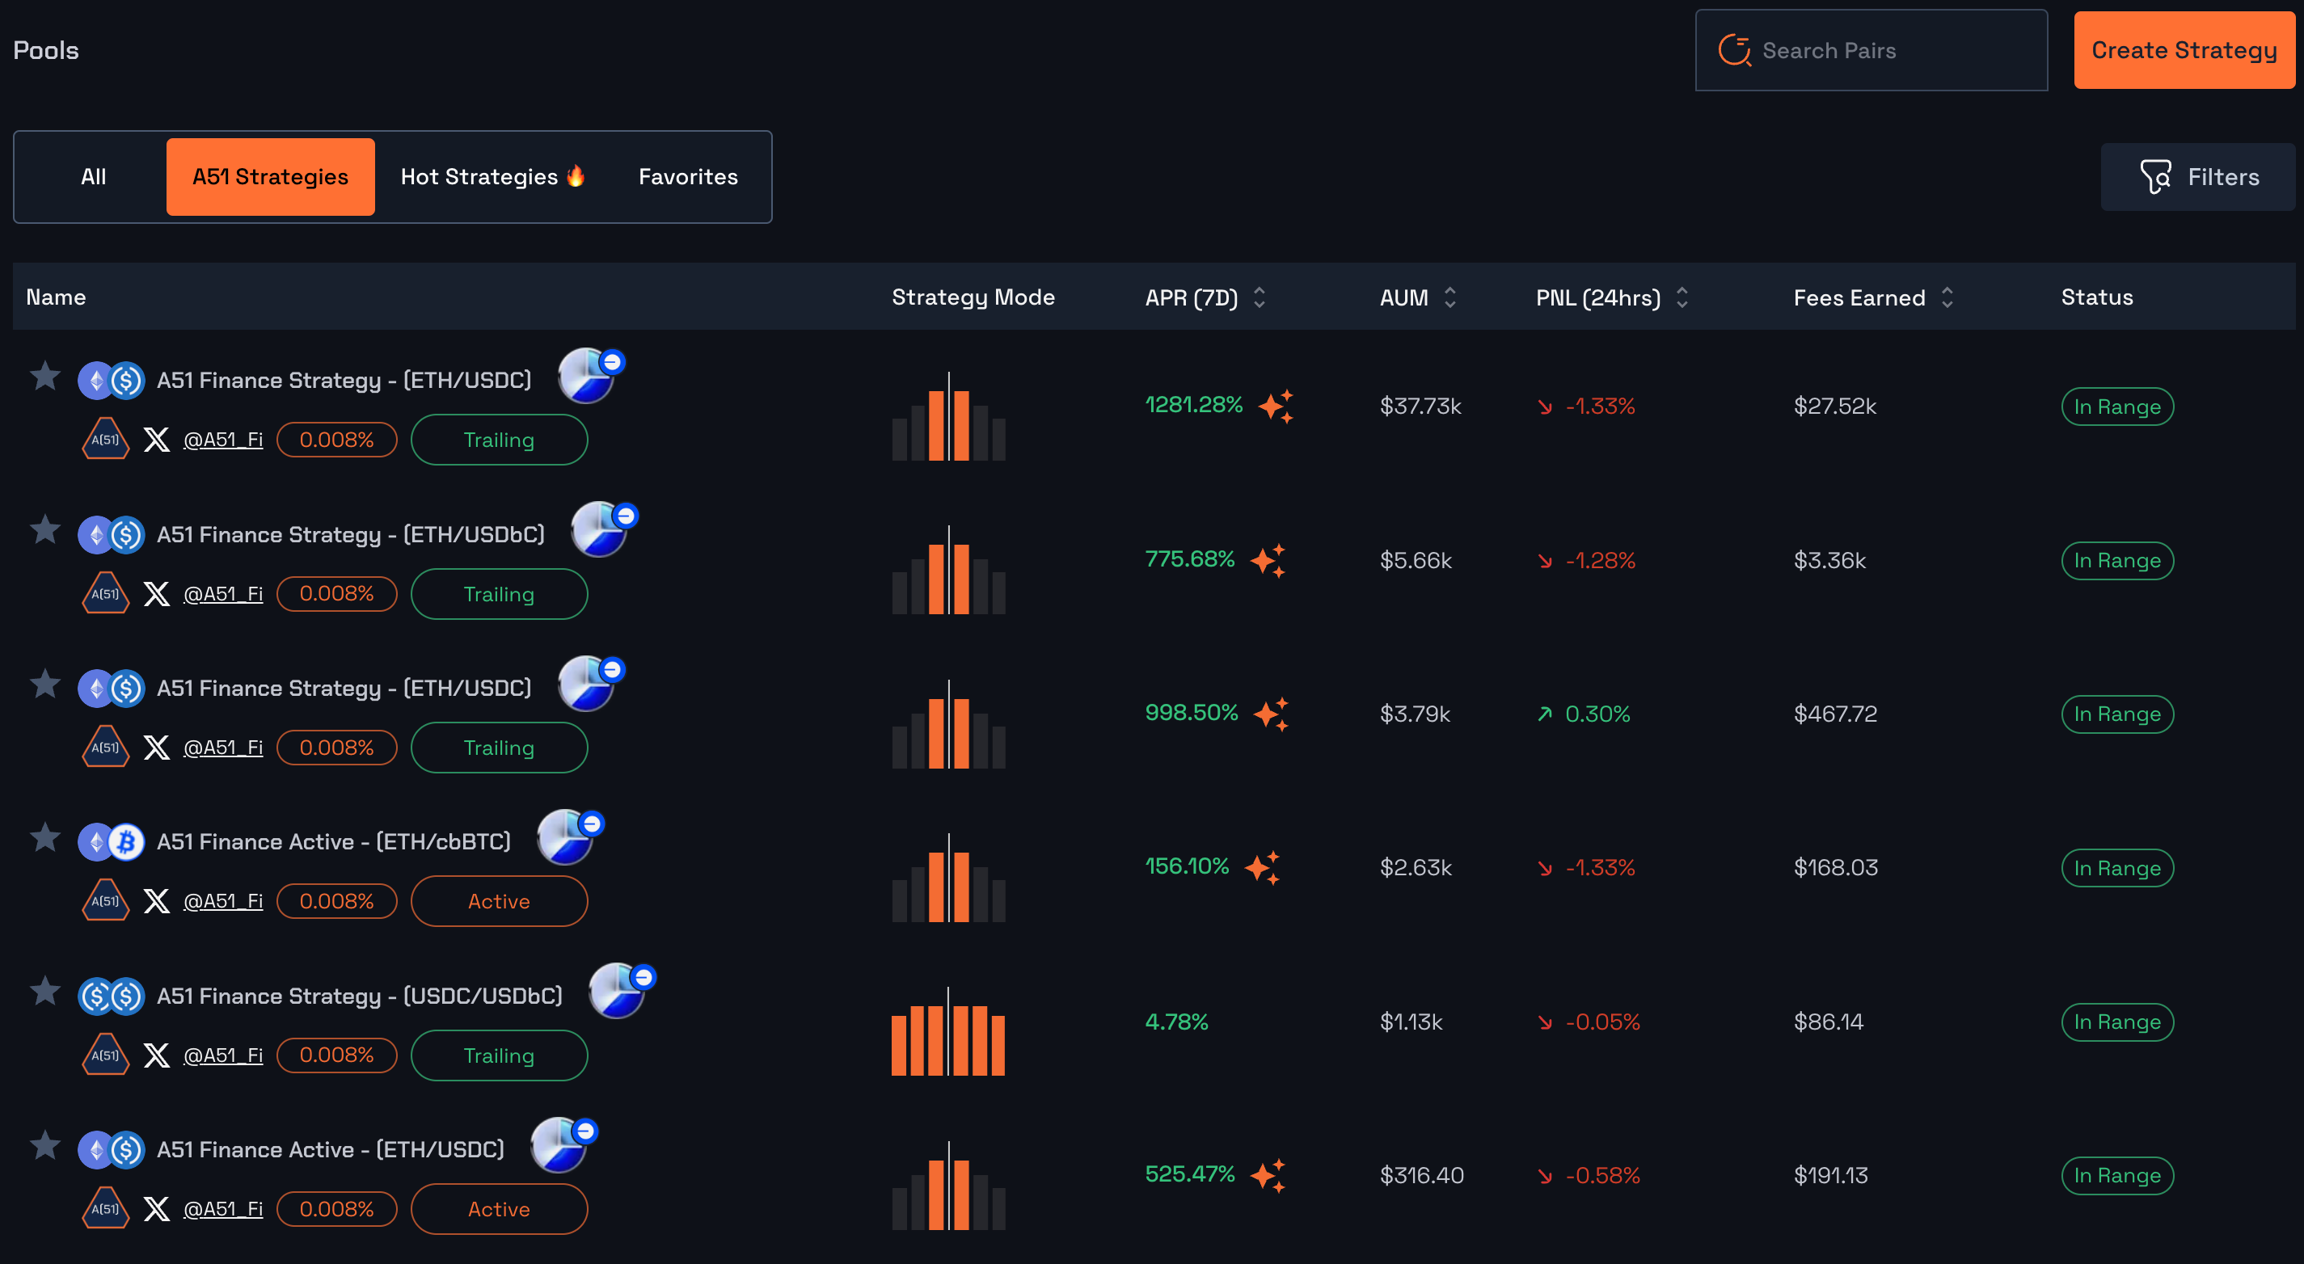
You can also search pools by filtering through modes.

Add Liquidity
To add liquidity to a pool of your choice, select the strategy to which you want to add liquidity.
This will open a new page with 4 tabs:
Overview
Position
Transactions
Analytics

Overview
It is an overview of the strategy with details including:
A graphical representation of the volume, liquidity, and fees for the last 7 days, 1 month, and 1 year.
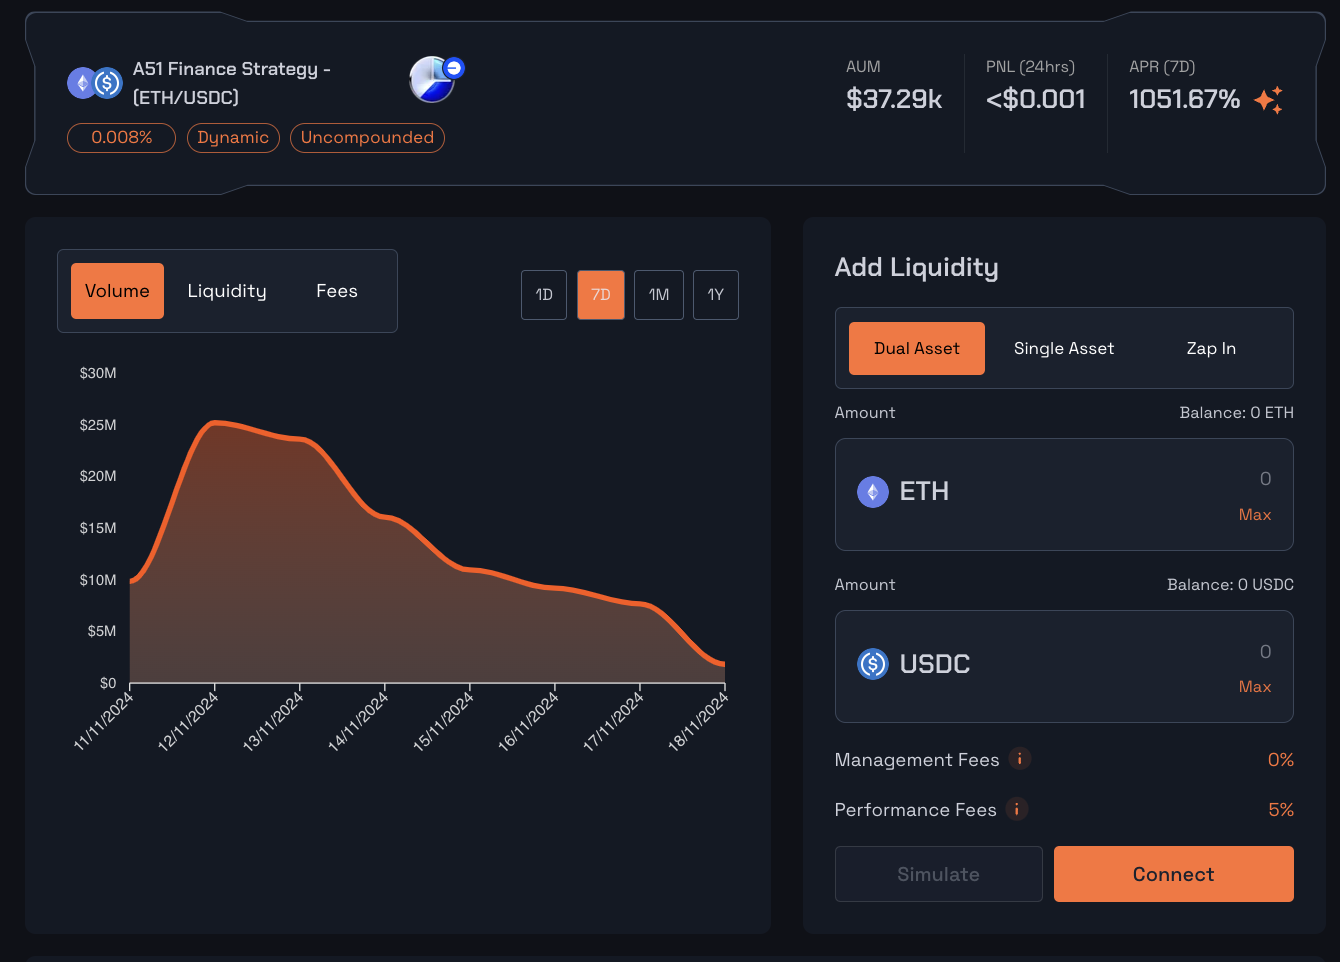
A section where you can add liquidity.
Go to the Add Liquidity section.
Here you can see 2 more tabs, Single Asset and Zap In. Why would you use them? Learn more about Single Asset and Zap In.
Enter the amount of tokens that you want to deposit.
Click Deposit to add liquidity.
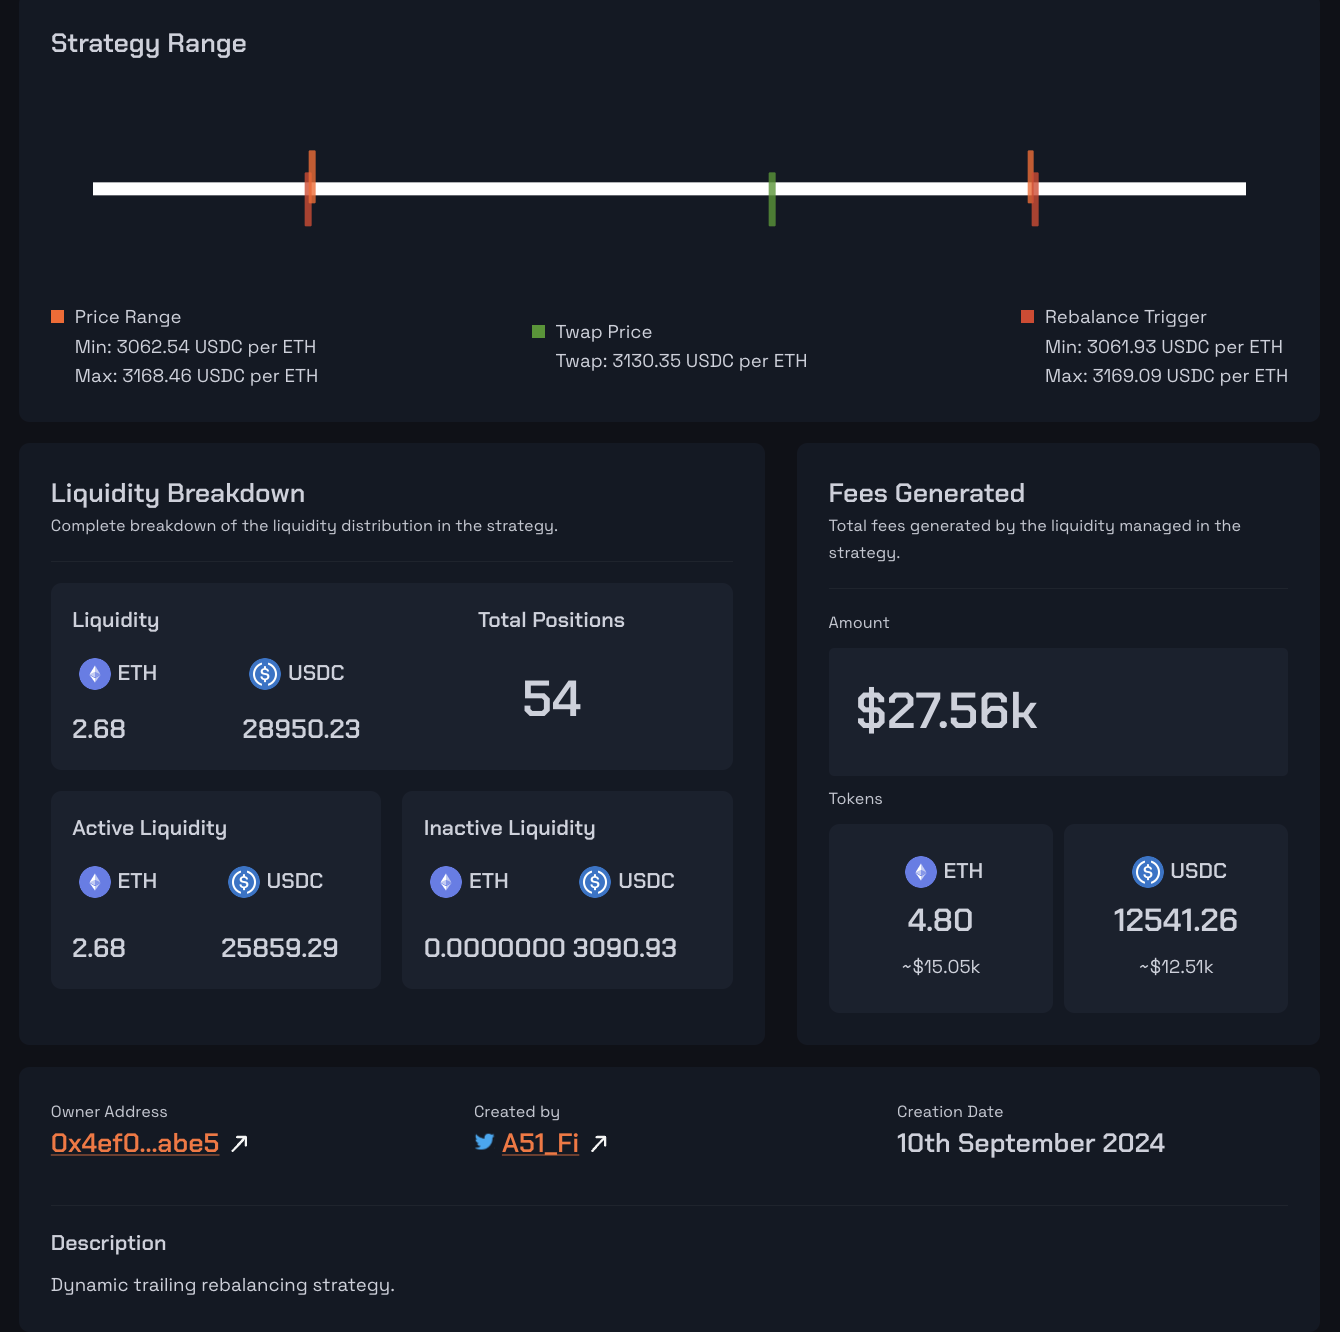
A diagram of strategy range.
A section displaying the breakdown of liquidity
The proportion of each token in the pool.
Total positions in the pool.
Active liquidity (liquidity available on the DEX and is being used).
Inactive liquidity (liquidity that is not available on the DEX and is not being used).
A section displaying the fee generated and how much fee is generated through each token.
A section showing the general details of the strategy:
The wallet address of the strategy creator
X account of the strategy creator (if connected)
Date of strategy creation
Strategy description
Position
You can create more than one liquidity position in a single pool.
In the Position tab, you can view your liquidity position(s) in the respective pool. You can also view your position(s) in the Positions tab on the top navigation bar of the page.
Transactions
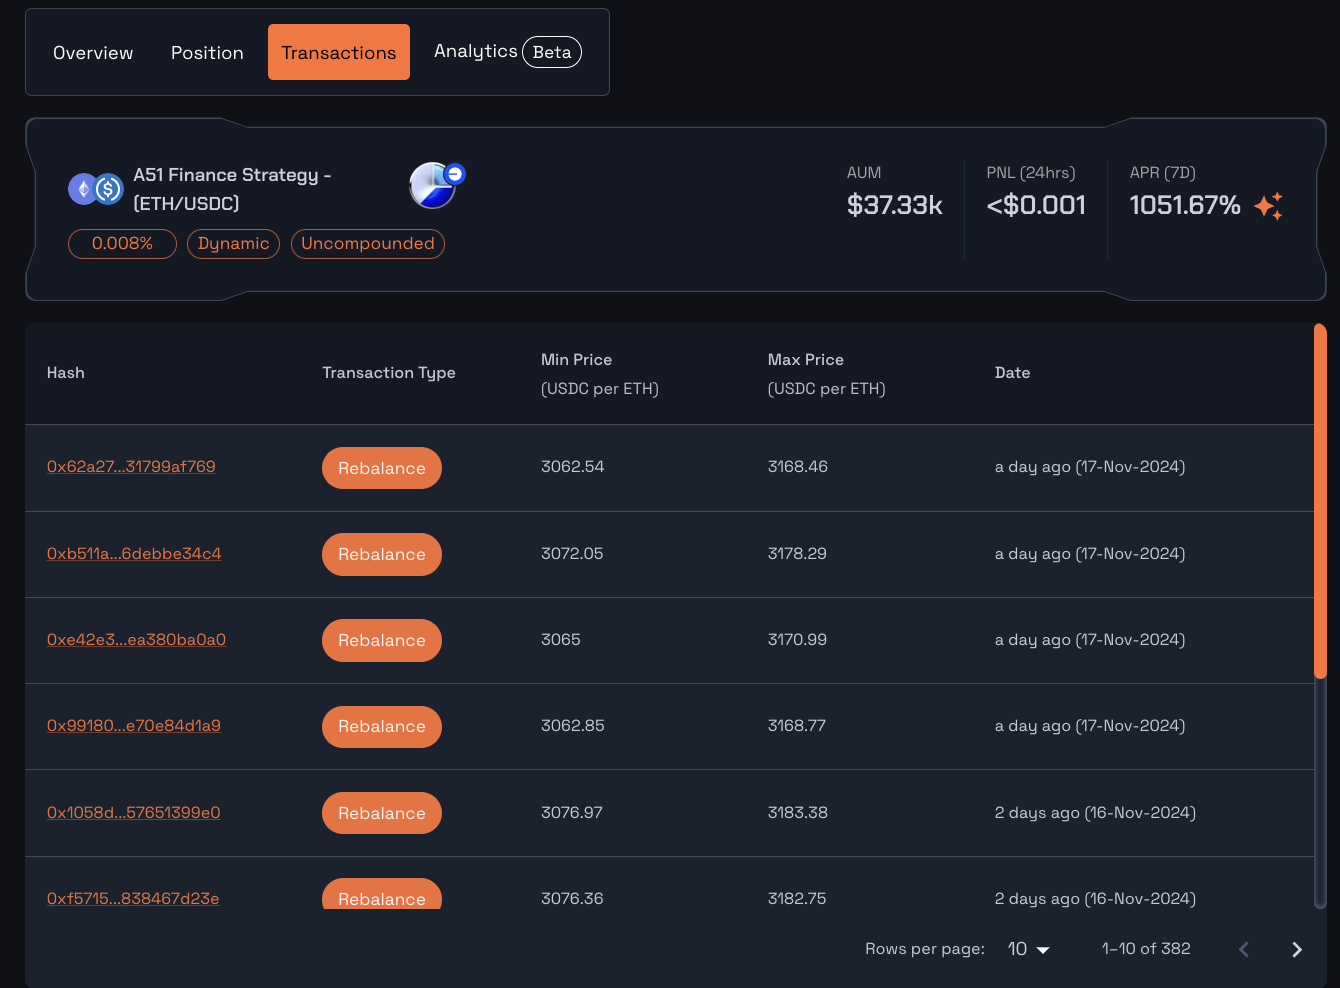
You can view the history of the strategy/pool displaying the decisions and edits made by the strategy creator on the Transactions tab.
Analytics
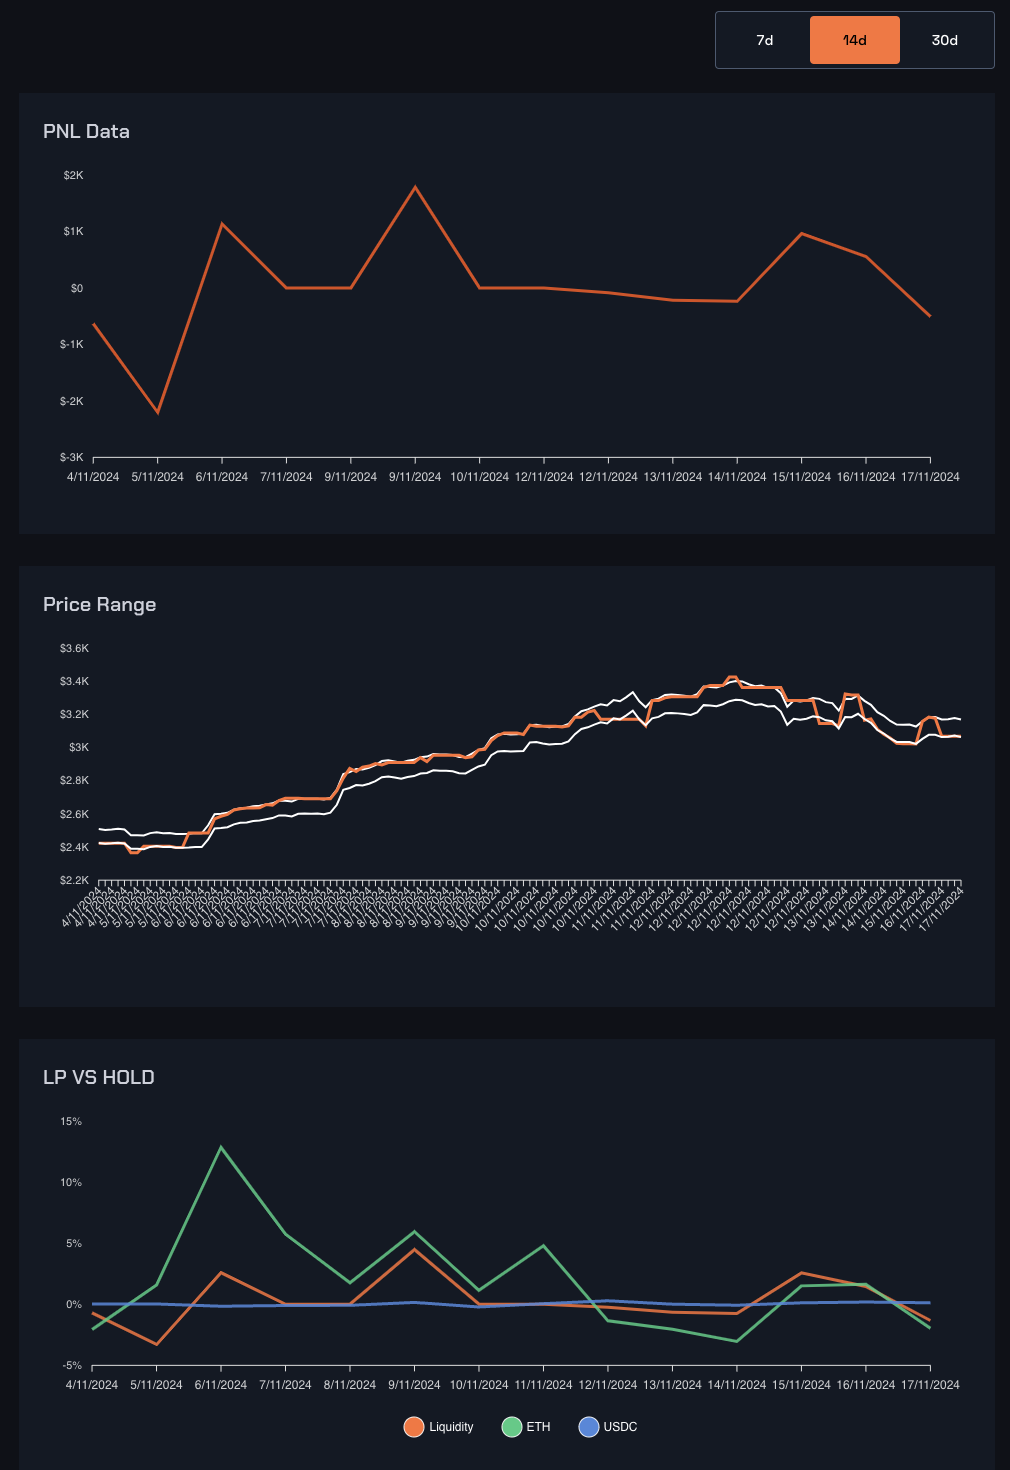
To see how your strategy has been performing, you will visit the Analytics section. It shows the PnL Data, Price Ranges, and LP vs HOLD data in a graphical manner for last 7, 14, and 30 days.
